Comparison of apo and holo CDR loops
Introduction
The following notebook aims to quantify the movement of CDR domains in TCR variable regions between unbound (apo) and bound (holo) conformations. The holo conforomations in this case are TCRs bound to class I pMHC complexes.
[1]:
import os
import itertools

import matplotlib.pyplot as plt
import numpy as np
import pandas as pd
import scipy
import seaborn as sns
[2]:
DATA_DIR = '../data/processed/apo-holo-tcr-pmhc-class-I-comparisons'
[3]:
NOISE_LEVEL = 0.5 # Å
[4]:
summary_df = pd.read_csv('../data/processed/apo-holo-tcr-pmhc-class-I/apo_holo_summary.csv')

ids = summary_df['file_name'].str.replace('.pdb', '', regex=True)
ids.name = 'id'
summary_df = summary_df.set_index(ids)

summary_df
[4]:
| file_name | pdb_id | structure_type | state | alpha_chain | beta_chain | antigen_chain | mhc_chain1 | mhc_chain2 | cdr_sequences_collated | peptide_sequence | mhc_slug | |
|---|---|---|---|---|---|---|---|---|---|---|---|---|
| id | ||||||||||||
| 1ao7_D-E-C-A-B_tcr_pmhc | 1ao7_D-E-C-A-B_tcr_pmhc.pdb | 1ao7 | tcr_pmhc | holo | D | E | C | A | B | DRGSQS-IYSNGD-AVTTDSWGKLQ-MNHEY-SVGAGI-ASRPGLA... | LLFGYPVYV | hla_a_02_01 |
| 1b0g_C-A-B_pmhc | 1b0g_C-A-B_pmhc.pdb | 1b0g | pmhc | apo | NaN | NaN | C | A | B | NaN | ALWGFFPVL | hla_a_02_01 |
| 1b0g_F-D-E_pmhc | 1b0g_F-D-E_pmhc.pdb | 1b0g | pmhc | apo | NaN | NaN | F | D | E | NaN | ALWGFFPVL | hla_a_02_01 |
| 1bd2_D-E-C-A-B_tcr_pmhc | 1bd2_D-E-C-A-B_tcr_pmhc.pdb | 1bd2 | tcr_pmhc | holo | D | E | C | A | B | NSMFDY-ISSIKDK-AAMEGAQKLV-MNHEY-SVGAGI-ASSYPGG... | LLFGYPVYV | hla_a_02_01 |
| 1bii_P-A-B_pmhc | 1bii_P-A-B_pmhc.pdb | 1bii | pmhc | apo | NaN | NaN | P | A | B | NaN | RGPGRAFVTI | h2_dd |
| ... | ... | ... | ... | ... | ... | ... | ... | ... | ... | ... | ... | ... |
| 7rtd_C-A-B_pmhc | 7rtd_C-A-B_pmhc.pdb | 7rtd | pmhc | apo | NaN | NaN | C | A | B | NaN | YLQPRTFLL | hla_a_02_01 |
| 7rtr_D-E-C-A-B_tcr_pmhc | 7rtr_D-E-C-A-B_tcr_pmhc.pdb | 7rtr | tcr_pmhc | holo | D | E | C | A | B | DRGSQS-IYSNGD-AVNRDDKII-SEHNR-FQNEAQ-ASSPDIEQY | YLQPRTFLL | hla_a_02_01 |
| 8gvb_A-B-P-H-L_tcr_pmhc | 8gvb_A-B-P-H-L_tcr_pmhc.pdb | 8gvb | tcr_pmhc | holo | A | B | P | H | L | YGATPY-YFSGDTLV-AVGFTGGGNKLT-SEHNR-FQNEAQ-ASSD... | RYPLTFGW | hla_a_24_02 |
| 8gvg_A-B-P-H-L_tcr_pmhc | 8gvg_A-B-P-H-L_tcr_pmhc.pdb | 8gvg | tcr_pmhc | holo | A | B | P | H | L | YGATPY-YFSGDTLV-AVGFTGGGNKLT-SEHNR-FQNEAQ-ASSD... | RFPLTFGW | hla_a_24_02 |
| 8gvi_A-B-P-H-L_tcr_pmhc | 8gvi_A-B-P-H-L_tcr_pmhc.pdb | 8gvi | tcr_pmhc | holo | A | B | P | H | L | YGATPY-YFSGDTLV-AVVFTGGGNKLT-SEHNR-FQNEAQ-ASSL... | RYPLTFGW | hla_a_24_02 |
391 rows × 12 columns
Calculating RMSD between conformations
RMSD is used to compute the difference between all states of the same TCR. Comparions between the different apo forms and the differenceholo forms are also done so that these can be used as a control for the differences in apo to holo comparisons. This process is done two different ways. The first, termed framework alignment, computes the comparison between TCRs after aligning on the framework region of the proteins. This method captures the “global” conformational changes that these loops undergo including any combined rotations and deformations. The second method, termed loop alignment, does the same calculations as the first method, but after aligning the two loops being compared on their backbones. This method captures the deformation aspects of loops regardless of any hinging from the framework region.
[5]:
def categorize_movement(rmsd: float) -> str:
    if rmsd < NOISE_LEVEL:
        return f'Little Movement (<{NOISE_LEVEL} Å)'

    if NOISE_LEVEL <= rmsd < 1.0:
        return f'Some Movement ({NOISE_LEVEL} to 1.0 Å)'

    if 1.0 <= rmsd < 2.0:
        return 'Movement (1.0 to 2.0 Å)'

    if 2.0 <= rmsd < 4.0:
        return 'Large Movement (2.0 to 4.0 Å)'

    if 4.0 <= rmsd:
        return 'Significant Movement (>4.0 Å)'


movement_order = pd.CategoricalDtype(categories=[f'Little Movement (<{NOISE_LEVEL} Å)',
                                                 f'Some Movement ({NOISE_LEVEL} to 1.0 Å)',
                                                 'Movement (1.0 to 2.0 Å)',
                                                 'Large Movement (2.0 to 4.0 Å)',
                                                 'Significant Movement (>4.0 Å)'], ordered=True)
Framework Alignment
[6]:
results_framework = pd.read_csv(os.path.join(DATA_DIR, 'rmsd_cdr_fw_align_results.csv'))
[7]:
results_framework = results_framework.merge(
    summary_df[['cdr_sequences_collated', 'peptide_sequence', 'mhc_slug']],
    how='left',
    left_on='complex_id',
    right_index=True,
)
[8]:
results_framework_holo_holo = pd.read_csv(os.path.join(DATA_DIR, 'rmsd_cdr_fw_align_holo.csv'))
[9]:
results_framework_holo_holo['cdr_sequences_collated'] = None

results_framework_holo_holo['mhc_slug'] = None
results_framework_holo_holo['peptide_sequence'] = None
[10]:
cdr_pattern = r'[A-Z]+-[A-Z]+-[A-Z]+-[A-Z]+-[A-Z]+-[A-Z]+'
cdr_complex_ids = results_framework_holo_holo['complex_id'].str.contains(cdr_pattern)

holo_cdr_sequences_collated = results_framework_holo_holo[cdr_complex_ids]['complex_id']
results_framework_holo_holo.loc[cdr_complex_ids, 'cdr_sequences_collated'] = holo_cdr_sequences_collated
[11]:
results_framework_holo_holo = results_framework_holo_holo.query('cdr_sequences_collated.notnull()')
[12]:
results_framework = pd.concat([results_framework, results_framework_holo_holo])
[13]:
results_framework = results_framework.merge(
    summary_df[['file_name','pdb_id', 'structure_type', 'state', 'alpha_chain', 'beta_chain', 'antigen_chain', 'mhc_chain1', 'mhc_chain2']],
    how='left',
    left_on='structure_x_name',
    right_on='file_name',
).merge(
    summary_df[['file_name', 'pdb_id', 'structure_type', 'state', 'alpha_chain', 'beta_chain', 'antigen_chain', 'mhc_chain1', 'mhc_chain2']],
    how='left',
    left_on='structure_y_name',
    right_on='file_name',
    suffixes=('_x', '_y')
)
[14]:
results_framework['comparison'] = results_framework['state_x'] + '-' + results_framework['state_y']
results_framework['comparison'] = results_framework['comparison'].map(lambda entry: 'apo-holo' if entry == 'holo-apo' else entry)
[15]:
results_framework['structure_comparison'] = results_framework.apply(
    lambda row: '-'.join(sorted([row.structure_x_name, row.structure_y_name])),
    axis='columns',
)
results_framework = results_framework.drop_duplicates(['structure_comparison', 'chain_type', 'cdr'])
[16]:
results_framework = results_framework.groupby(['cdr_sequences_collated', 'comparison', 'cdr', 'chain_type'])['rmsd'].mean().reset_index()
[17]:
results_framework['movement'] = results_framework['rmsd'].map(categorize_movement).astype(movement_order)
[18]:
results_framework
[18]:
| cdr_sequences_collated | comparison | cdr | chain_type | rmsd | movement | |
|---|---|---|---|---|---|---|
| 0 | ATGYPS-ATKADDK-ALSDPVNDMR-SGHAT-FQNNGV-ASSLRGR... | apo-holo | 1 | alpha_chain | 1.267393 | Movement (1.0 to 2.0 Å) |
| 1 | ATGYPS-ATKADDK-ALSDPVNDMR-SGHAT-FQNNGV-ASSLRGR... | apo-holo | 1 | beta_chain | 0.372470 | Little Movement (<0.5 Å) |
| 2 | ATGYPS-ATKADDK-ALSDPVNDMR-SGHAT-FQNNGV-ASSLRGR... | apo-holo | 2 | alpha_chain | 0.736941 | Some Movement (0.5 to 1.0 Å) |
| 3 | ATGYPS-ATKADDK-ALSDPVNDMR-SGHAT-FQNNGV-ASSLRGR... | apo-holo | 2 | beta_chain | 0.909569 | Some Movement (0.5 to 1.0 Å) |
| 4 | ATGYPS-ATKADDK-ALSDPVNDMR-SGHAT-FQNNGV-ASSLRGR... | apo-holo | 3 | alpha_chain | 2.747458 | Large Movement (2.0 to 4.0 Å) |
| ... | ... | ... | ... | ... | ... | ... |
| 366 | YSGSPE-HISR-ALSGFNNAGNMLT-SGHAT-FQNNGV-ASSLGGA... | apo-holo | 1 | beta_chain | 0.646786 | Some Movement (0.5 to 1.0 Å) |
| 367 | YSGSPE-HISR-ALSGFNNAGNMLT-SGHAT-FQNNGV-ASSLGGA... | apo-holo | 2 | alpha_chain | 2.650761 | Large Movement (2.0 to 4.0 Å) |
| 368 | YSGSPE-HISR-ALSGFNNAGNMLT-SGHAT-FQNNGV-ASSLGGA... | apo-holo | 2 | beta_chain | 0.786869 | Some Movement (0.5 to 1.0 Å) |
| 369 | YSGSPE-HISR-ALSGFNNAGNMLT-SGHAT-FQNNGV-ASSLGGA... | apo-holo | 3 | alpha_chain | 1.956881 | Movement (1.0 to 2.0 Å) |
| 370 | YSGSPE-HISR-ALSGFNNAGNMLT-SGHAT-FQNNGV-ASSLGGA... | apo-holo | 3 | beta_chain | 3.343748 | Large Movement (2.0 to 4.0 Å) |
371 rows × 6 columns
Loop Alignment
[19]:
results_loop = pd.read_csv(os.path.join(DATA_DIR, 'rmsd_cdr_loop_align_results.csv'))
[20]:
results_loop= results_loop.merge(
    summary_df[['cdr_sequences_collated', 'peptide_sequence', 'mhc_slug']],
    how='left',
    left_on='complex_id',
    right_index=True,
)
[21]:
results_loop_holo_holo = pd.read_csv(os.path.join(DATA_DIR, 'rmsd_cdr_loop_align_holo.csv'))
[22]:
results_loop_holo_holo['cdr_sequences_collated'] = None

results_loop_holo_holo['mhc_slug'] = None
results_loop_holo_holo['peptide_sequence'] = None
[23]:
cdr_pattern = r'[A-Z]+-[A-Z]+-[A-Z]+-[A-Z]+-[A-Z]+-[A-Z]+'
cdr_complex_ids = results_loop_holo_holo['complex_id'].str.contains(cdr_pattern)

holo_cdr_sequences_collated = results_loop_holo_holo[cdr_complex_ids]['complex_id']
results_loop_holo_holo.loc[cdr_complex_ids, 'cdr_sequences_collated'] = holo_cdr_sequences_collated
[24]:
results_loop_holo_holo = results_loop_holo_holo.query('cdr_sequences_collated.notnull()')
[25]:
results_loop = pd.concat([results_loop, results_loop_holo_holo])
[26]:
results_loop = results_loop.merge(
    summary_df[['file_name', 'pdb_id', 'structure_type', 'state', 'alpha_chain', 'beta_chain', 'antigen_chain', 'mhc_chain1', 'mhc_chain2']],
    how='left',
    left_on='structure_x_name',
    right_on='file_name',
).merge(
    summary_df[['file_name', 'pdb_id', 'structure_type', 'state', 'alpha_chain', 'beta_chain', 'antigen_chain', 'mhc_chain1', 'mhc_chain2']],
    how='left',
    left_on='structure_y_name',
    right_on='file_name',
    suffixes=('_x', '_y')
)
[27]:
results_loop['comparison'] = results_loop['state_x'] + '-' + results_loop['state_y']
results_loop['comparison'] = results_loop['comparison'].map(lambda entry: 'apo-holo' if entry == 'holo-apo' else entry)
[28]:
results_loop['structure_comparison'] = results_loop.apply(
    lambda row: '-'.join(sorted([row.structure_x_name, row.structure_y_name])),
    axis='columns',
)
results_loop = results_loop.drop_duplicates(['structure_comparison', 'chain_type', 'cdr'])
[29]:
results_loop = results_loop.groupby(['cdr_sequences_collated', 'comparison', 'cdr', 'chain_type'])['rmsd'].mean().reset_index()
[30]:
results_loop['movement'] = results_loop['rmsd'].map(categorize_movement).astype(movement_order)
[ ]:
results_loop
| cdr_sequences_collated | comparison | cdr | chain_type | rmsd | movement | |
|---|---|---|---|---|---|---|
| 0 | ATGYPS-ATKADDK-ALSDPVNDMR-SGHAT-FQNNGV-ASSLRGR... | apo-holo | 1 | alpha_chain | 0.773921 | Some Movement (0.5 to 1.0 Å) |
| 1 | ATGYPS-ATKADDK-ALSDPVNDMR-SGHAT-FQNNGV-ASSLRGR... | apo-holo | 1 | beta_chain | 0.233623 | Little Movement (<0.5 Å) |
| 2 | ATGYPS-ATKADDK-ALSDPVNDMR-SGHAT-FQNNGV-ASSLRGR... | apo-holo | 2 | alpha_chain | 0.438770 | Little Movement (<0.5 Å) |
| 3 | ATGYPS-ATKADDK-ALSDPVNDMR-SGHAT-FQNNGV-ASSLRGR... | apo-holo | 2 | beta_chain | 0.777213 | Some Movement (0.5 to 1.0 Å) |
| 4 | ATGYPS-ATKADDK-ALSDPVNDMR-SGHAT-FQNNGV-ASSLRGR... | apo-holo | 3 | alpha_chain | 1.235649 | Movement (1.0 to 2.0 Å) |
| ... | ... | ... | ... | ... | ... | ... |
| 366 | YSGSPE-HISR-ALSGFNNAGNMLT-SGHAT-FQNNGV-ASSLGGA... | apo-holo | 1 | beta_chain | 0.113593 | Little Movement (<0.5 Å) |
| 367 | YSGSPE-HISR-ALSGFNNAGNMLT-SGHAT-FQNNGV-ASSLGGA... | apo-holo | 2 | alpha_chain | 1.082823 | Movement (1.0 to 2.0 Å) |
| 368 | YSGSPE-HISR-ALSGFNNAGNMLT-SGHAT-FQNNGV-ASSLGGA... | apo-holo | 2 | beta_chain | 0.201656 | Little Movement (<0.5 Å) |
| 369 | YSGSPE-HISR-ALSGFNNAGNMLT-SGHAT-FQNNGV-ASSLGGA... | apo-holo | 3 | alpha_chain | 1.475462 | Movement (1.0 to 2.0 Å) |
| 370 | YSGSPE-HISR-ALSGFNNAGNMLT-SGHAT-FQNNGV-ASSLGGA... | apo-holo | 3 | beta_chain | 2.503307 | Large Movement (2.0 to 4.0 Å) |
371 rows × 6 columns
Visualizing and analysing the results
Measuring the distance between apo and holo confomations
Since RMSD was calculated for all pairings of the same TCR, the apo-holo (or holo-apo) comparisons were selected.
Framework Alignment
[32]:
results_framework['chain_type_formatted'] = results_framework['chain_type'].str.replace('_', ' ').str.title()
[33]:
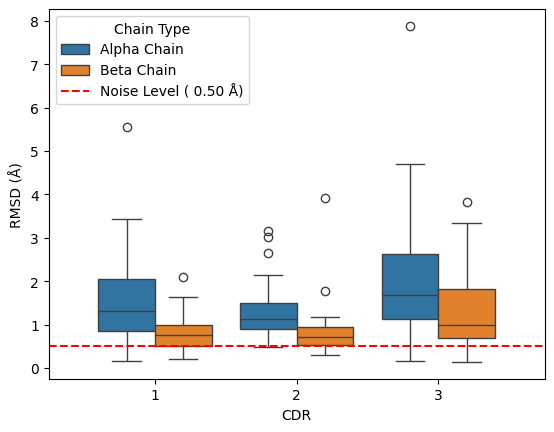
sns.boxplot(data=results_framework.query("comparison == 'apo-holo'"), y='rmsd', x='cdr', hue='chain_type_formatted')

x = np.linspace(-0.75, 2.75)
y = np.repeat(NOISE_LEVEL, len(x))

plt.plot(x, y, '--r', label=f'Noise Level ({NOISE_LEVEL: .2f} Å)')
plt.xlim(-0.75, 2.75)

plt.legend(title='Chain Type')
plt.xlabel('CDR')
plt.ylabel('RMSD (Å)')

plt.show()

results_framework.query("comparison == 'apo-holo'").groupby(['chain_type', 'cdr'])['rmsd'].describe()
[33]:
| count | mean | std | min | 25% | 50% | 75% | max | ||
|---|---|---|---|---|---|---|---|---|---|
| chain_type | cdr | ||||||||
| alpha_chain | 1 | 22.0 | 1.688538 | 1.118687 | 0.516638 | 0.892867 | 1.567689 | 2.080515 | 5.527264 |
| 2 | 21.0 | 1.327793 | 0.721653 | 0.496448 | 0.861526 | 1.062559 | 1.427239 | 3.075190 | |
| 3 | 22.0 | 2.378904 | 1.668149 | 0.545553 | 1.420477 | 1.851111 | 2.925171 | 7.818020 | |
| beta_chain | 1 | 22.0 | 0.823919 | 0.448008 | 0.322518 | 0.473089 | 0.746551 | 0.988184 | 2.121011 |
| 2 | 22.0 | 0.911582 | 0.769147 | 0.311457 | 0.452917 | 0.779960 | 0.959763 | 3.928769 | |
| 3 | 22.0 | 1.498268 | 0.976070 | 0.451473 | 0.894738 | 1.051407 | 1.986540 | 3.849010 |
[34]:
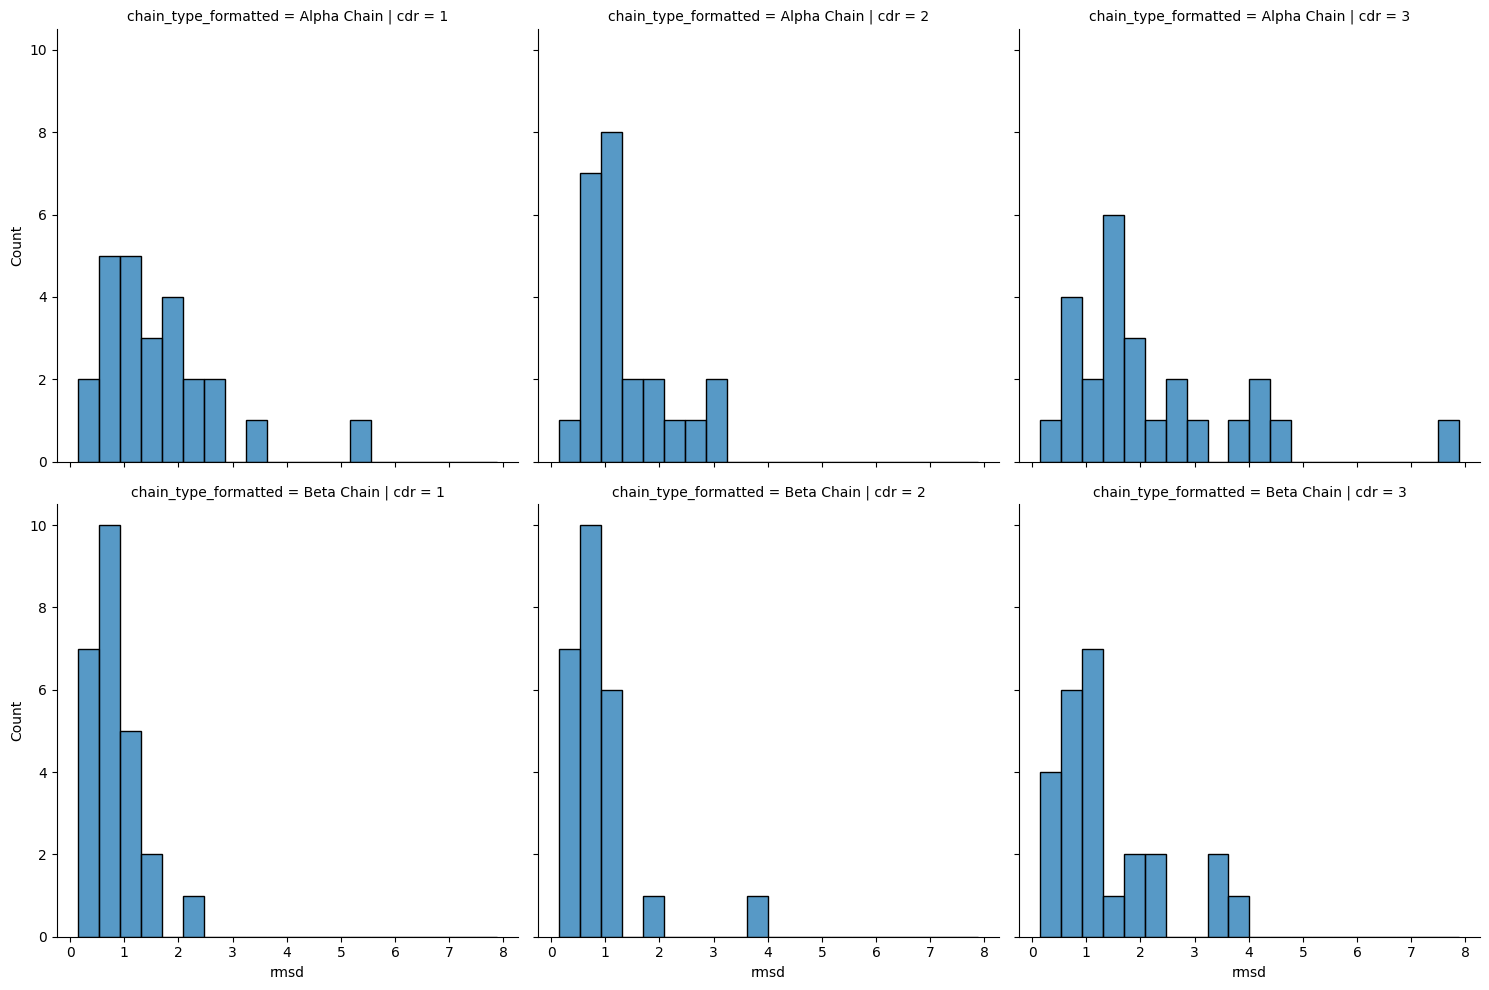
sns.displot(results_framework.query("comparison == 'apo-holo'"),
            x='rmsd', col='cdr', row='chain_type_formatted')
[34]:
<seaborn.axisgrid.FacetGrid at 0x7f7f4ebb42e0>
[ ]:
treatments = [(group, df['rmsd'].to_numpy()) for group, df in results_framework.query("comparison == 'apo-holo'").groupby(['chain_type', 'cdr'])]
print(scipy.stats.kruskal(*[values for _, values in treatments]))
KruskalResult(statistic=35.4925691934713, pvalue=1.1997168153031063e-06)
[ ]:
combos = [(((chain_x, cdr_x), sample_x), ((chain_y, cdr_y), sample_y))
          for ((chain_x, cdr_x), sample_x), ((chain_y, cdr_y), sample_y) in itertools.combinations(treatments, 2)
          if cdr_x == cdr_y]

significance_level = 0.05 / len(combos)

framework_stats = {
    'chain_type_x': [],
    'cdr_x': [],
    'chain_type_y': [],
    'cdr_y': [],
    'statistic': [],
    'p_val': [],
}

for ((chain_x, cdr_x), sample_x), ((chain_y, cdr_y), sample_y) in combos:
    stat, p_val = scipy.stats.ranksums(sample_x, sample_y)

    framework_stats['chain_type_x'].append(chain_x)
    framework_stats['cdr_x'].append(cdr_x)
    framework_stats['chain_type_y'].append(chain_y)
    framework_stats['cdr_y'].append(cdr_y)

    framework_stats['statistic'].append(stat)
    framework_stats['p_val'].append(p_val)

framework_stats = pd.DataFrame(framework_stats)
framework_stats['significant'] = framework_stats['p_val'] < significance_level

framework_stats
| chain_type_x | cdr_x | chain_type_y | cdr_y | statistic | p_val | significant | |
|---|---|---|---|---|---|---|---|
| 0 | alpha_chain | 1 | beta_chain | 1 | 3.427003 | 0.000610 | True |
| 1 | alpha_chain | 2 | beta_chain | 2 | 2.672612 | 0.007526 | True |
| 2 | alpha_chain | 3 | beta_chain | 3 | 2.206427 | 0.027354 | False |
[ ]:
combos = list(itertools.combinations([(cdr, df['rmsd'].to_numpy())
                                       for cdr, df in results_framework.query("comparison == 'apo-holo'").groupby('cdr')], 2))

significance_level = 0.05 / len(combos)

framework_stats = {
    'cdr_x': [],
    'cdr_y': [],
    'statistic': [],
    'p_val': [],
}

for (cdr_x, sample_x), (cdr_y, sample_y) in combos:
    stat, p_val = scipy.stats.ranksums(sample_x, sample_y)


    framework_stats['cdr_x'].append(cdr_x)
    framework_stats['cdr_y'].append(cdr_y)

    framework_stats['statistic'].append(stat)
    framework_stats['p_val'].append(p_val)

framework_stats = pd.DataFrame(framework_stats)
framework_stats['significant'] =  framework_stats['p_val'] < significance_level

framework_stats
| cdr_x | cdr_y | statistic | p_val | significant | |
|---|---|---|---|---|---|
| 0 | 1 | 2 | 0.517867 | 0.604551 | False |
| 1 | 1 | 3 | -2.854099 | 0.004316 | True |
| 2 | 2 | 3 | -3.540175 | 0.000400 | True |
The figure above shows there appears to be an increase in the movement of CDR3 compared to CDR1 and CDR2 and that the alpha chain has more movement than the beta chain of the TCR.
[38]:
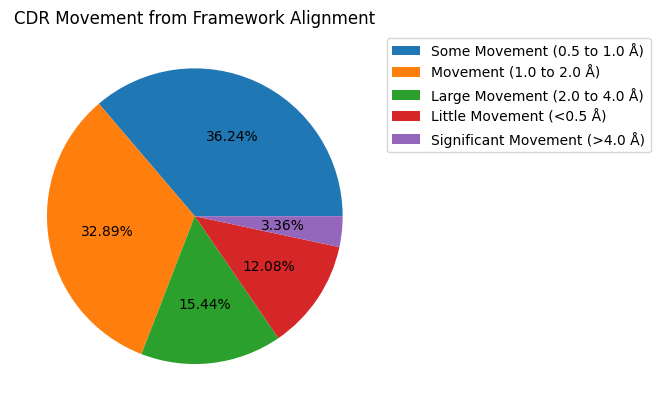
movement_counts = results_framework.query("comparison == 'apo-holo'")['movement'].dropna().value_counts()
movement_counts = movement_counts[movement_counts > 0]
movement_counts = movement_counts.sort_index()

ax = movement_counts.plot.pie(title='CDR Movement from Framework Alignment',
                            autopct='%1.2f%%',
                            legend=True,
                            ylabel='',
                            labeldistance=None)
ax.legend(bbox_to_anchor=(1, 1), loc='upper left')

plt.show()
[39]:
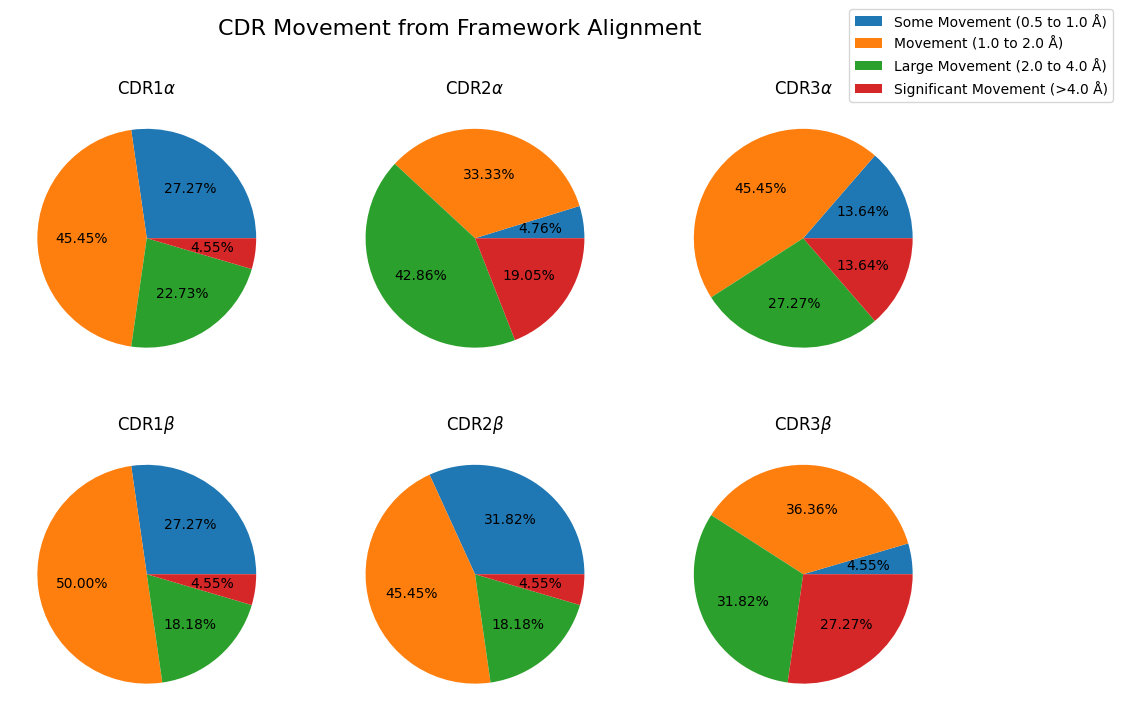
fig, axes = plt.subplots(nrows=2, ncols=3, figsize=(12, 8))

lines = []

for i, chain_type in enumerate(('alpha_chain', 'beta_chain')):
    for j, cdr in enumerate((1, 2, 3)):
        movement_counts = results_framework.query(
            "comparison == 'apo-holo' and cdr == @cdr and chain_type == @chain_type"
        )['movement'].dropna().value_counts()

        movement_counts = movement_counts[movement_counts > 0]
        movement_counts = movement_counts.sort_index()

        ax = movement_counts.plot.pie(
            title='CDR' + str(cdr) + (r'$\alpha$' if chain_type == 'alpha_chain' else r'$\beta$'),
            autopct='%1.2f%%',
            legend=False,
            ylabel='',
            labeldistance=None,
            ax=axes[i, j],
        )
        lines.append(ax)

lines_labels = [fig.axes[0].get_legend_handles_labels()]
lines, labels = [sum(lol, []) for lol in zip(*lines_labels)]
fig.legend(lines, labels, bbox_to_anchor=(1.05, 1))

fig.suptitle('CDR Movement from Framework Alignment', fontsize=16)

plt.show()
Loop Alignment
[40]:
results_loop['chain_type_formatted'] = results_loop['chain_type'].str.replace('_', ' ').str.title()
[41]:
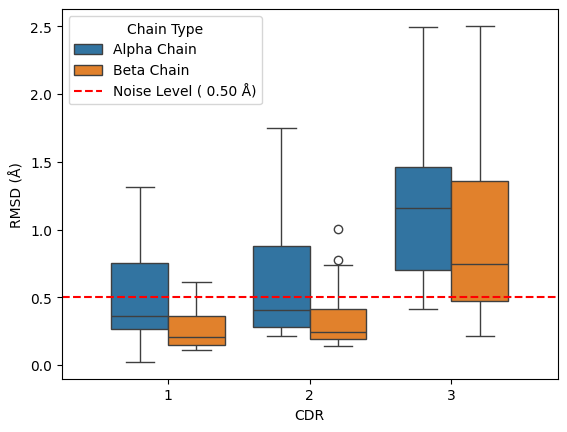
sns.boxplot(data=results_loop.query("comparison == 'apo-holo'"), y='rmsd', x='cdr', hue='chain_type_formatted')

x = np.linspace(-0.75, 2.75)
y = np.repeat(NOISE_LEVEL, len(x))

plt.plot(x, y, '--r', label=f'Noise Level ({NOISE_LEVEL: .2f} Å)')
plt.xlim(-0.75, 2.75)

plt.legend(title='Chain Type')
plt.xlabel('CDR')
plt.ylabel('RMSD (Å)')

plt.show()

results_loop.query("comparison == 'apo-holo'").groupby(['chain_type', 'cdr'])['rmsd'].describe()
[41]:
| count | mean | std | min | 25% | 50% | 75% | max | ||
|---|---|---|---|---|---|---|---|---|---|
| chain_type | cdr | ||||||||
| alpha_chain | 1 | 22.0 | 0.498767 | 0.346897 | 0.022408 | 0.268565 | 0.360193 | 0.751915 | 1.317612 |
| 2 | 21.0 | 0.592797 | 0.434249 | 0.215395 | 0.277901 | 0.405613 | 0.879081 | 1.748959 | |
| 3 | 22.0 | 1.202180 | 0.624488 | 0.414519 | 0.700162 | 1.159450 | 1.462535 | 2.495455 | |
| beta_chain | 1 | 22.0 | 0.270704 | 0.164392 | 0.113593 | 0.150641 | 0.203997 | 0.361489 | 0.613358 |
| 2 | 22.0 | 0.346270 | 0.239926 | 0.140385 | 0.193959 | 0.242435 | 0.413456 | 1.005001 | |
| 3 | 22.0 | 0.968526 | 0.689371 | 0.215410 | 0.473122 | 0.745160 | 1.355077 | 2.503307 |
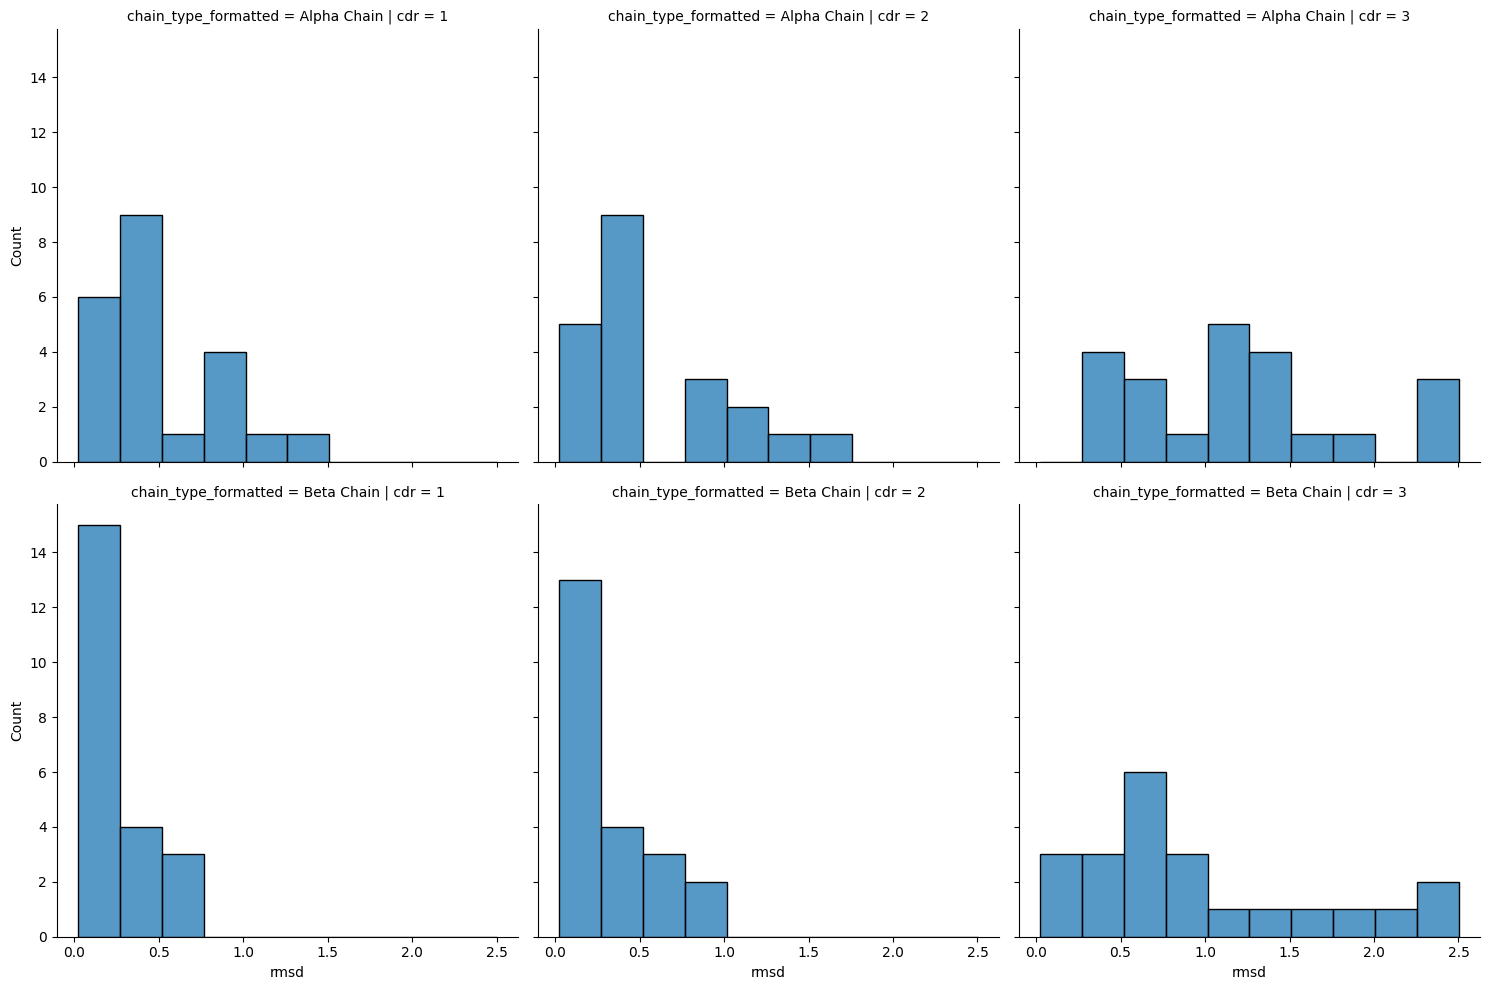
[42]:
sns.displot(results_loop.query("comparison == 'apo-holo'"),
            x='rmsd', col='cdr', row='chain_type_formatted')
[42]:
<seaborn.axisgrid.FacetGrid at 0x7f7f4b860f10>
[ ]:
treatments = [(group, df['rmsd'].to_numpy()) for group, df in results_loop.query("comparison == 'apo-holo'").groupby(['chain_type', 'cdr'])]
print(scipy.stats.kruskal(*[values for _, values in treatments]))
KruskalResult(statistic=54.747881311378876, pvalue=1.4709296709056658e-10)
[ ]:
combos = [(((chain_x, cdr_x), sample_x), ((chain_y, cdr_y), sample_y))
          for ((chain_x, cdr_x), sample_x), ((chain_y, cdr_y), sample_y) in itertools.combinations(treatments, 2)
          if cdr_x == cdr_y]

significance_level = 0.05 / len(combos)

loop_stats = {
    'chain_x': [],
    'cdr_x': [],
    'chain_y': [],
    'cdr_y': [],
    'statistic': [],
    'p_val': [],
}

for ((chain_x, cdr_x), sample_x), ((chain_y, cdr_y), sample_y) in combos:
    stat, p_val = scipy.stats.ranksums(sample_x, sample_y)

    loop_stats['chain_x'].append(chain_x)
    loop_stats['cdr_x'].append(cdr_x)
    loop_stats['chain_y'].append(chain_y)
    loop_stats['cdr_y'].append(cdr_y)

    loop_stats['statistic'].append(stat)
    loop_stats['p_val'].append(p_val)

loop_stats = pd.DataFrame(loop_stats)

loop_stats['significant'] = loop_stats['p_val'] < significance_level

loop_stats
| chain_x | cdr_x | chain_y | cdr_y | statistic | p_val | significant | |
|---|---|---|---|---|---|---|---|
| 0 | alpha_chain | 1 | beta_chain | 1 | 2.769770 | 0.005610 | True |
| 1 | alpha_chain | 2 | beta_chain | 2 | 2.769798 | 0.005609 | True |
| 2 | alpha_chain | 3 | beta_chain | 3 | 1.502248 | 0.133033 | False |
[ ]:
combos = list(itertools.combinations([(cdr, df['rmsd'].to_numpy())
                                      for cdr, df in results_loop.query("comparison == 'apo-holo'").groupby('cdr')], 2))

significance_level = 0.05 / len(combos)

loop_stats = {
    'cdr_x': [],
    'cdr_y': [],
    'statistic': [],
    'p_val': [],
}

for (cdr_x, sample_x), (cdr_y, sample_y) in combos:
    stat, p_val = scipy.stats.ranksums(sample_x, sample_y)

    loop_stats['cdr_x'].append(cdr_x)
    loop_stats['cdr_y'].append(cdr_y)

    loop_stats['statistic'].append(stat)
    loop_stats['p_val'].append(p_val)

loop_stats = pd.DataFrame(loop_stats)

loop_stats['significant'] = loop_stats['p_val'] < significance_level

loop_stats
| cdr_x | cdr_y | statistic | p_val | significant | |
|---|---|---|---|---|---|
| 0 | 1 | 2 | -1.230996 | 2.183243e-01 | False |
| 1 | 1 | 3 | -5.816687 | 6.002526e-09 | True |
| 2 | 2 | 3 | -5.127736 | 2.932472e-07 | True |
The figure above shows there appears to be an increase in the movement of CDR3 compared to CDR1 and CDR2 and that the alpha chain has more movement than the beta chain of the TCR. In this alignment procedure, the CDR-1 and CDR-2 loops median drop below the noise level line, indicating that these show different effects to the CDR3 loops.
[46]:
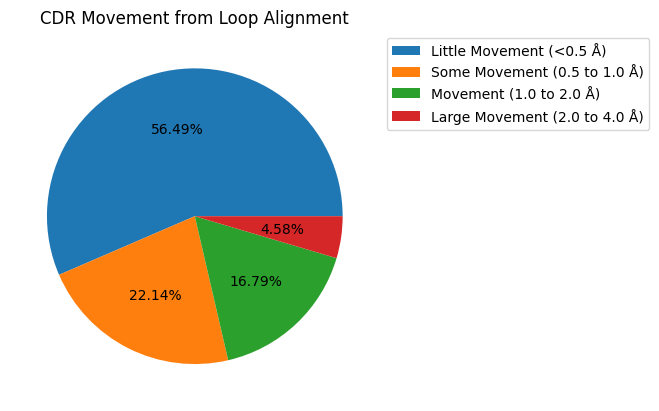
movement_counts = results_loop.query("comparison == 'apo-holo'")['movement'].dropna().value_counts()
movement_counts = movement_counts[movement_counts > 0]

ax = movement_counts.plot.pie(title='CDR Movement from Loop Alignment',
                              autopct='%1.2f%%',
                              legend=True,
                              ylabel='',
                              labeldistance=None)
ax.legend(bbox_to_anchor=(1, 1), loc='upper left')

plt.show()
[47]:
results_loop.query("comparison == 'apo-holo'")['movement'].dropna().value_counts()
[47]:
Little Movement (<0.5 Å)         74
Some Movement (0.5 to 1.0 Å)     29
Movement (1.0 to 2.0 Å)          22
Large Movement (2.0 to 4.0 Å)     6
Significant Movement (>4.0 Å)     0
Name: movement, dtype: int64
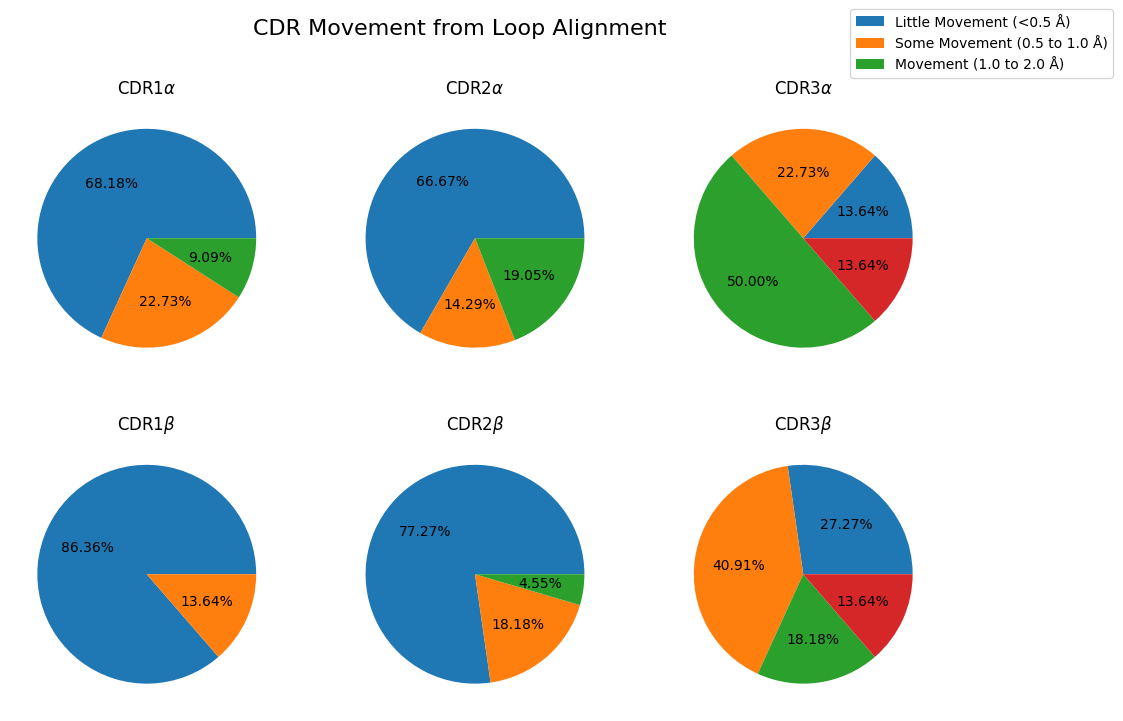
[48]:
fig, axes = plt.subplots(nrows=2, ncols=3, figsize=(12, 8))

lines = []

for i, chain_type in enumerate(('alpha_chain', 'beta_chain')):
    for j, cdr in enumerate((1, 2, 3)):
        movement_counts = results_loop.query(
            "comparison == 'apo-holo' and cdr == @cdr and chain_type == @chain_type"
        )['movement'].dropna().value_counts()

        movement_counts = movement_counts[movement_counts > 0]
        movement_counts = movement_counts.sort_index()

        ax = movement_counts.plot.pie(
            title='CDR' + str(cdr) + (r'$\alpha$' if chain_type == 'alpha_chain' else r'$\beta$'),
            autopct='%1.2f%%',
            legend=False,
            ylabel='',
            labeldistance=None,
            ax=axes[i, j],
        )
        lines.append(ax)

lines_labels = [fig.axes[0].get_legend_handles_labels()]
lines, labels = [sum(lol, []) for lol in zip(*lines_labels)]
fig.legend(lines, labels, bbox_to_anchor=(1.05, 1))

fig.suptitle('CDR Movement from Loop Alignment', fontsize=16)

plt.show()
Comparison of apo-holo, apo-apo and holo-holo conformational changes
The following analysis aims to ascertain whether there is notable movement in the CDR domains between the apo and holo conformations, using apo-apo and holo-holo differences as controls.
Framework Alignment
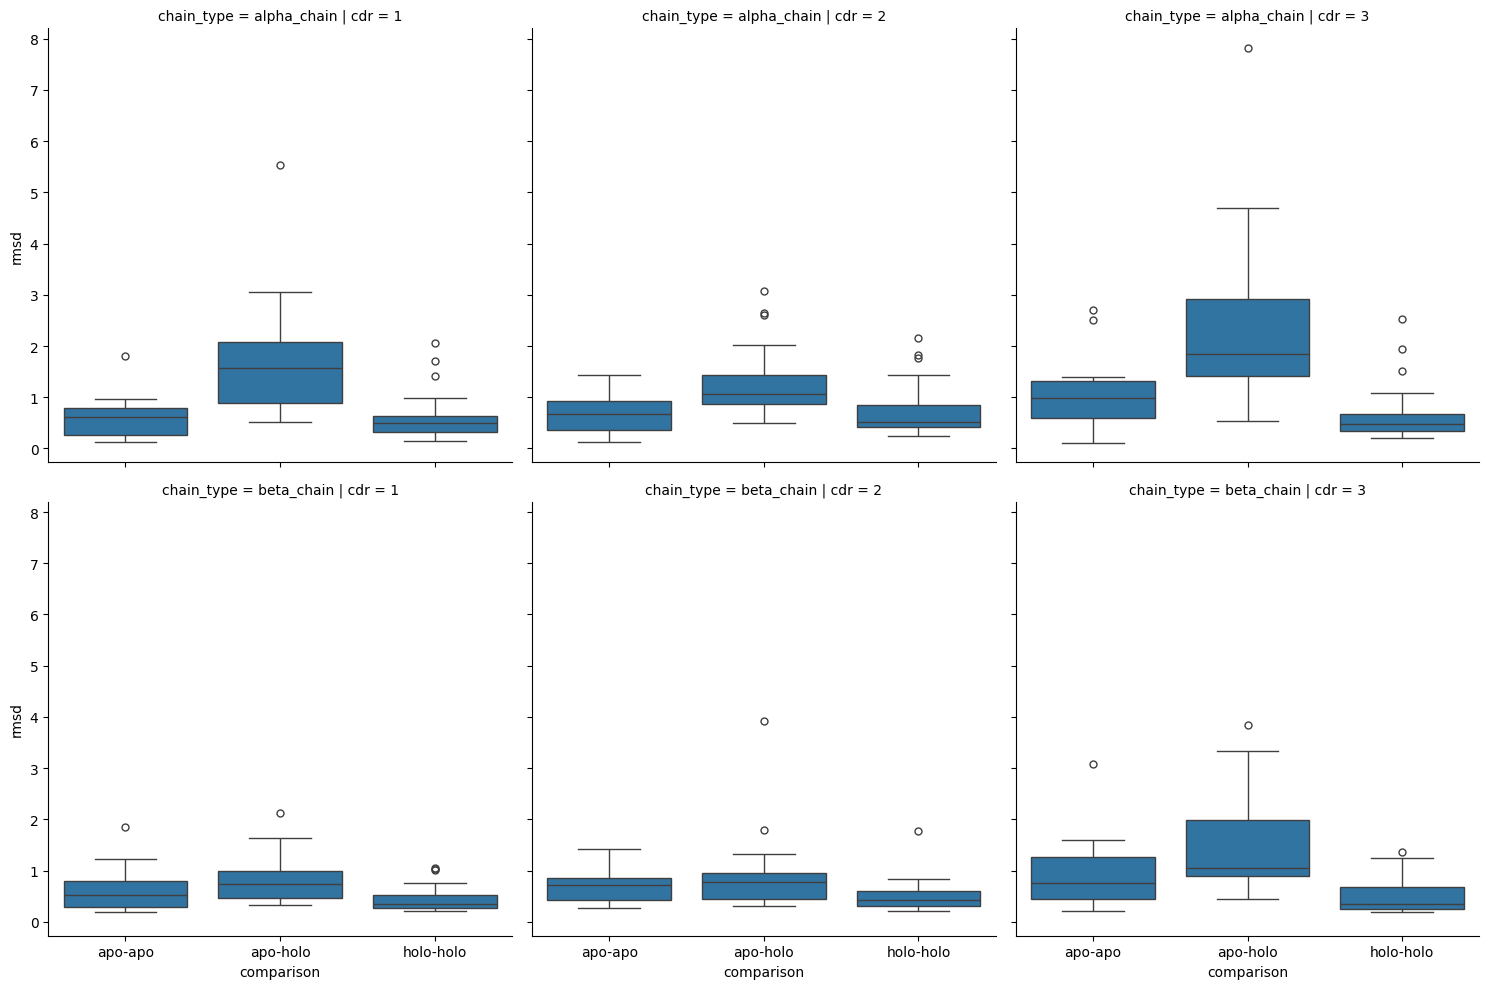
[49]:
sns.catplot(results_framework.sort_values(['comparison', 'chain_type', 'cdr']),
            x='comparison',
            y='rmsd',
            col='cdr',
            row='chain_type',
            kind='box')
[49]:
<seaborn.axisgrid.FacetGrid at 0x7f7f4c13a890>
[50]:
sns.displot(results_framework.sort_values(['comparison', 'chain_type', 'cdr']),
            hue='comparison',
            x='rmsd',
            col='cdr',
            row='chain_type',
            kind='kde')
[50]:
<seaborn.axisgrid.FacetGrid at 0x7f7f48d3d630>
[ ]:
results_framework.groupby(['comparison', 'chain_type', 'cdr']).size()
comparison  chain_type   cdr
apo-apo     alpha_chain  1      10
                         2      10
                         3      10
            beta_chain   1      10
                         2      10
                         3      10
apo-holo    alpha_chain  1      22
                         2      21
                         3      22
            beta_chain   1      22
                         2      22
                         3      22
holo-holo   alpha_chain  1      30
                         2      30
                         3      30
            beta_chain   1      30
                         2      30
                         3      30
dtype: int64
[ ]:
treatment_options = ['comparison', 'chain_type', 'cdr']
treatments = [(group, df['rmsd'].to_numpy()) for group, df in results_framework.groupby(treatment_options)]
treatments
print(scipy.stats.kruskal(*[values for _, values in treatments]))
KruskalResult(statistic=136.04243752942966, pvalue=1.2772577873614328e-20)
[ ]:
combos = []
for pairing in list(itertools.combinations(treatments, 2)):
    chain_type_x = pairing[0][0][1]
    cdr_x = pairing[0][0][2]
    chain_type_y = pairing[1][0][1]
    cdr_y = pairing[1][0][2]

    if (chain_type_x, cdr_x) == (chain_type_y, cdr_y):
        combos.append(pairing)

significance_level = 0.05 / len(combos)
print(significance_level)
statistics = []
p_vals = []

for ((comparison_x, chain_type_x, cdr_x), sample_x), ((comparison_y, chain_type_y, cdr_y), sample_y) in combos:
    stat, p_val = scipy.stats.ranksums(sample_x, sample_y)

    statistics.append(stat)
    p_vals.append(p_val)

momvement_statistics_fw = pd.DataFrame({
    'comparison_x': [name for ((name, _, _), _), _ in combos],
    'chain_type_x': [name for ((_, name, _), _), _ in combos],
    'cdr_x': [name for ((_, _, name), _), _ in combos],
    'comparison_y': [name for _, ((name, _, _), _) in combos],
    'chain_type_y': [name for _, ((_, name, _), _) in combos],
    'cdr_y': [name for _, ((_, _, name), _) in combos],
    'statistic': statistics,
    'p_val': p_vals,
    'significant': [p_val < significance_level for p_val in p_vals],
})

momvement_statistics_fw['p_val'] = momvement_statistics_fw['p_val'].map(lambda num: f'{num:.2e}')

momvement_statistics_fw
0.002777777777777778
| comparison_x | chain_type_x | cdr_x | comparison_y | chain_type_y | cdr_y | statistic | p_val | significant | |
|---|---|---|---|---|---|---|---|---|---|
| 0 | apo-apo | alpha_chain | 1 | apo-holo | alpha_chain | 1 | -3.130495 | 1.75e-03 | True |
| 1 | apo-apo | alpha_chain | 1 | holo-holo | alpha_chain | 1 | 0.156174 | 8.76e-01 | False |
| 2 | apo-apo | alpha_chain | 2 | apo-holo | alpha_chain | 2 | -2.577720 | 9.95e-03 | False |
| 3 | apo-apo | alpha_chain | 2 | holo-holo | alpha_chain | 2 | 0.124939 | 9.01e-01 | False |
| 4 | apo-apo | alpha_chain | 3 | apo-holo | alpha_chain | 3 | -2.601970 | 9.27e-03 | False |
| 5 | apo-apo | alpha_chain | 3 | holo-holo | alpha_chain | 3 | 1.811616 | 7.00e-02 | False |
| 6 | apo-apo | beta_chain | 1 | apo-holo | beta_chain | 1 | -1.300985 | 1.93e-01 | False |
| 7 | apo-apo | beta_chain | 1 | holo-holo | beta_chain | 1 | 1.061982 | 2.88e-01 | False |
| 8 | apo-apo | beta_chain | 2 | apo-holo | beta_chain | 2 | -0.813116 | 4.16e-01 | False |
| 9 | apo-apo | beta_chain | 2 | holo-holo | beta_chain | 2 | 1.749146 | 8.03e-02 | False |
| 10 | apo-apo | beta_chain | 3 | apo-holo | beta_chain | 3 | -1.707543 | 8.77e-02 | False |
| 11 | apo-apo | beta_chain | 3 | holo-holo | beta_chain | 3 | 1.874085 | 6.09e-02 | False |
| 12 | apo-holo | alpha_chain | 1 | holo-holo | alpha_chain | 1 | 4.834162 | 1.34e-06 | True |
| 13 | apo-holo | alpha_chain | 2 | holo-holo | alpha_chain | 2 | 3.636405 | 2.76e-04 | True |
| 14 | apo-holo | alpha_chain | 3 | holo-holo | alpha_chain | 3 | 5.223118 | 1.76e-07 | True |
| 15 | apo-holo | beta_chain | 1 | holo-holo | beta_chain | 1 | 3.759904 | 1.70e-04 | True |
| 16 | apo-holo | beta_chain | 2 | holo-holo | beta_chain | 2 | 3.148688 | 1.64e-03 | True |
| 17 | apo-holo | beta_chain | 3 | holo-holo | beta_chain | 3 | 4.723032 | 2.32e-06 | True |
[54]:
combos = list(itertools.combinations(treatments, 2))

significance_level = 0.05 / len(combos)

statistics = []
p_vals = []

for ((comparison_x, chain_type_x, cdr_x), sample_x), ((comparison_y, chain_type_y, cdr_y), sample_y) in combos:
    stat, p_val = scipy.stats.ranksums(sample_x, sample_y)

    statistics.append(stat)
    p_vals.append(p_val)

pd.DataFrame({
    'comparison_x': [name for ((name, _, _), _), _ in combos],
    'chain_type_x': [name for ((_, name, _), _), _ in combos],
    'cdr_x': [name for ((_, _, name), _), _ in combos],
    'comparison_y': [name for _, ((name, _, _), _) in combos],
    'chain_type_y': [name for _, ((_, name, _), _) in combos],
    'cdr_y': [name for _, ((_, _, name), _) in combos],
    'statistic': statistics,
    'p_val': p_vals,
    'significant': [p_val < significance_level for p_val in p_vals],
})
[54]:
| comparison_x | chain_type_x | cdr_x | comparison_y | chain_type_y | cdr_y | statistic | p_val | significant | |
|---|---|---|---|---|---|---|---|---|---|
| 0 | apo-apo | alpha_chain | 1 | apo-apo | alpha_chain | 2 | -0.302372 | 0.762369 | False |
| 1 | apo-apo | alpha_chain | 1 | apo-apo | alpha_chain | 3 | -1.360672 | 0.173617 | False |
| 2 | apo-apo | alpha_chain | 1 | apo-apo | beta_chain | 1 | -0.226779 | 0.820596 | False |
| 3 | apo-apo | alpha_chain | 1 | apo-apo | beta_chain | 2 | -0.604743 | 0.545350 | False |
| 4 | apo-apo | alpha_chain | 1 | apo-apo | beta_chain | 3 | -0.982708 | 0.325751 | False |
| ... | ... | ... | ... | ... | ... | ... | ... | ... | ... |
| 148 | holo-holo | alpha_chain | 3 | holo-holo | beta_chain | 2 | 0.650515 | 0.515360 | False |
| 149 | holo-holo | alpha_chain | 3 | holo-holo | beta_chain | 3 | 1.153185 | 0.248834 | False |
| 150 | holo-holo | beta_chain | 1 | holo-holo | beta_chain | 2 | -1.005341 | 0.314733 | False |
| 151 | holo-holo | beta_chain | 1 | holo-holo | beta_chain | 3 | -0.266120 | 0.790147 | False |
| 152 | holo-holo | beta_chain | 2 | holo-holo | beta_chain | 3 | 0.591377 | 0.554268 | False |
153 rows × 9 columns
The analysis of the plots and statistical tests shows that there is a statistically significant (p-value: 0.05) difference between the target and controls (as seen by the results of the Kruskal-Wallis test) but it also shows that there is a significant difference between the apo-holo comparisons and the holo-holo baseline.
Loop Alignment
[55]:
sns.catplot(results_loop.sort_values(['comparison', 'chain_type', 'cdr']),
            x='comparison',
            y='rmsd',
            col='cdr',
            row='chain_type',
            kind='box')
[55]:
<seaborn.axisgrid.FacetGrid at 0x7f7f4b710d00>

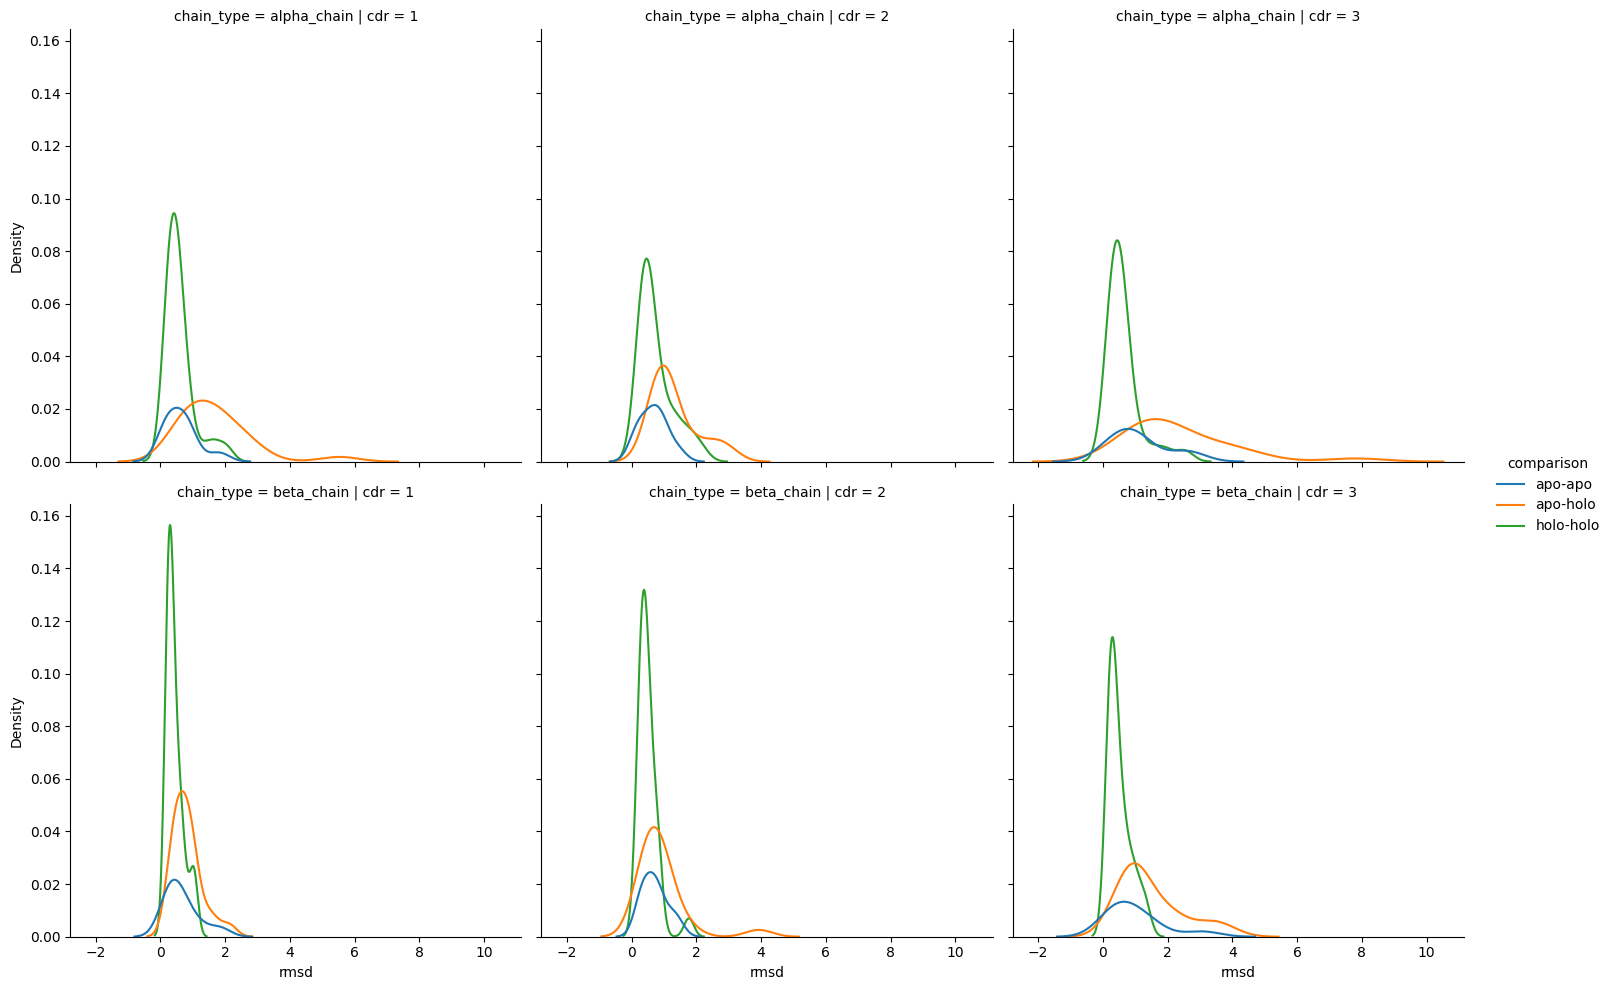
[56]:
sns.displot(results_loop.sort_values(['comparison', 'chain_type', 'cdr']),
            x='rmsd',
            hue='comparison',
            col='cdr',
            row='chain_type',
            kind='kde')
[56]:
<seaborn.axisgrid.FacetGrid at 0x7f7f487adf00>

[ ]:
results_loop.groupby(['comparison', 'chain_type', 'cdr']).size()
comparison  chain_type   cdr
apo-apo     alpha_chain  1      10
                         2      10
                         3      10
            beta_chain   1      10
                         2      10
                         3      10
apo-holo    alpha_chain  1      22
                         2      21
                         3      22
            beta_chain   1      22
                         2      22
                         3      22
holo-holo   alpha_chain  1      30
                         2      30
                         3      30
            beta_chain   1      30
                         2      30
                         3      30
dtype: int64
[ ]:
treatment_options = ['comparison', 'chain_type', 'cdr']
treatments = [(group, df['rmsd'].to_numpy()) for group, df in results_loop.groupby(treatment_options)]
treatments
print(scipy.stats.kruskal(*[values for _, values in treatments]))
KruskalResult(statistic=123.30531506577063, pvalue=3.608293657679283e-18)
[59]:
combos = []
for pairing in list(itertools.combinations(treatments, 2)):
    chain_type_x = pairing[0][0][1]
    cdr_x = pairing[0][0][2]
    chain_type_y = pairing[1][0][1]
    cdr_y = pairing[1][0][2]

    if (chain_type_x, cdr_x) == (chain_type_y, cdr_y):
        combos.append(pairing)

significance_level = 0.05 / len(combos)
print(significance_level)
statistics = []
p_vals = []

for ((comparison_x, chain_type_x, cdr_x), sample_x), ((comparison_y, chain_type_y, cdr_y), sample_y) in combos:
    stat, p_val = scipy.stats.ranksums(sample_x, sample_y)

    statistics.append(stat)
    p_vals.append(p_val)

momvement_statistics_loop = pd.DataFrame({
    'comparison_x': [name for ((name, _, _), _), _ in combos],
    'chain_type_x': [name for ((_, name, _), _), _ in combos],
    'cdr_x': [name for ((_, _, name), _), _ in combos],
    'comparison_y': [name for _, ((name, _, _), _) in combos],
    'chain_type_y': [name for _, ((_, name, _), _) in combos],
    'cdr_y': [name for _, ((_, _, name), _) in combos],
    'statistic': statistics,
    'p_val': p_vals,
    'significant': [p_val < significance_level for p_val in p_vals],
})

momvement_statistics_loop['p_val'] = momvement_statistics_loop['p_val'].map(lambda num: f'{num:.2e}')

momvement_statistics_loop
0.002777777777777778
[59]:
| comparison_x | chain_type_x | cdr_x | comparison_y | chain_type_y | cdr_y | statistic | p_val | significant | |
|---|---|---|---|---|---|---|---|---|---|
| 0 | apo-apo | alpha_chain | 1 | apo-holo | alpha_chain | 1 | -2.317380 | 2.05e-02 | False |
| 1 | apo-apo | alpha_chain | 1 | holo-holo | alpha_chain | 1 | -1.311860 | 1.90e-01 | False |
| 2 | apo-apo | alpha_chain | 2 | apo-holo | alpha_chain | 2 | -3.718679 | 2.00e-04 | True |
| 3 | apo-apo | alpha_chain | 2 | holo-holo | alpha_chain | 2 | -3.310884 | 9.30e-04 | True |
| 4 | apo-apo | alpha_chain | 3 | apo-holo | alpha_chain | 3 | -1.951478 | 5.10e-02 | False |
| 5 | apo-apo | alpha_chain | 3 | holo-holo | alpha_chain | 3 | 1.093216 | 2.74e-01 | False |
| 6 | apo-apo | beta_chain | 1 | apo-holo | beta_chain | 1 | -1.666887 | 9.55e-02 | False |
| 7 | apo-apo | beta_chain | 1 | holo-holo | beta_chain | 1 | -1.468033 | 1.42e-01 | False |
| 8 | apo-apo | beta_chain | 2 | apo-holo | beta_chain | 2 | -0.894427 | 3.71e-01 | False |
| 9 | apo-apo | beta_chain | 2 | holo-holo | beta_chain | 2 | 0.374817 | 7.08e-01 | False |
| 10 | apo-apo | beta_chain | 3 | apo-holo | beta_chain | 3 | -1.829510 | 6.73e-02 | False |
| 11 | apo-apo | beta_chain | 3 | holo-holo | beta_chain | 3 | 0.562226 | 5.74e-01 | False |
| 12 | apo-holo | alpha_chain | 1 | holo-holo | alpha_chain | 1 | 2.778254 | 5.47e-03 | False |
| 13 | apo-holo | alpha_chain | 2 | holo-holo | alpha_chain | 2 | 1.588535 | 1.12e-01 | False |
| 14 | apo-holo | alpha_chain | 3 | holo-holo | alpha_chain | 3 | 4.611902 | 3.99e-06 | True |
| 15 | apo-holo | beta_chain | 1 | holo-holo | beta_chain | 1 | 0.685303 | 4.93e-01 | False |
| 16 | apo-holo | beta_chain | 2 | holo-holo | beta_chain | 2 | 1.648431 | 9.93e-02 | False |
| 17 | apo-holo | beta_chain | 3 | holo-holo | beta_chain | 3 | 4.278511 | 1.88e-05 | True |
[60]:
combos = list(itertools.combinations(treatments, 2))

significance_level = 0.05 / len(combos)

statistics = []
p_vals = []

for ((comparison_x, chain_type_x, cdr_x), sample_x), ((comparison_y, chain_type_y, cdr_y), sample_y) in combos:
    stat, p_val = scipy.stats.ranksums(sample_x, sample_y)

    statistics.append(stat)
    p_vals.append(p_val)

pd.DataFrame({
    'comparison_x': [name for ((name, _, _), _), _ in combos],
    'chain_type_x': [name for ((_, name, _), _), _ in combos],
    'cdr_x': [name for ((_, _, name), _), _ in combos],
    'comparison_y': [name for _, ((name, _, _), _) in combos],
    'chain_type_y': [name for _, ((_, name, _), _) in combos],
    'cdr_y': [name for _, ((_, _, name), _) in combos],
    'statistic': statistics,
    'p_val': p_vals,
    'significant': [p_val < significance_level for p_val in p_vals],
})
[60]:
| comparison_x | chain_type_x | cdr_x | comparison_y | chain_type_y | cdr_y | statistic | p_val | significant | |
|---|---|---|---|---|---|---|---|---|---|
| 0 | apo-apo | alpha_chain | 1 | apo-apo | alpha_chain | 2 | 0.604743 | 0.545350 | False |
| 1 | apo-apo | alpha_chain | 1 | apo-apo | alpha_chain | 3 | -2.116601 | 0.034294 | False |
| 2 | apo-apo | alpha_chain | 1 | apo-apo | beta_chain | 1 | 0.680336 | 0.496292 | False |
| 3 | apo-apo | alpha_chain | 1 | apo-apo | beta_chain | 2 | -0.755929 | 0.449692 | False |
| 4 | apo-apo | alpha_chain | 1 | apo-apo | beta_chain | 3 | -1.360672 | 0.173617 | False |
| ... | ... | ... | ... | ... | ... | ... | ... | ... | ... |
| 148 | holo-holo | alpha_chain | 3 | holo-holo | beta_chain | 2 | 2.690765 | 0.007129 | False |
| 149 | holo-holo | alpha_chain | 3 | holo-holo | beta_chain | 3 | 1.626287 | 0.103889 | False |
| 150 | holo-holo | beta_chain | 1 | holo-holo | beta_chain | 2 | -0.931419 | 0.351637 | False |
| 151 | holo-holo | beta_chain | 1 | holo-holo | beta_chain | 3 | -1.877622 | 0.060433 | False |
| 152 | holo-holo | beta_chain | 2 | holo-holo | beta_chain | 3 | -0.887066 | 0.375044 | False |
153 rows × 9 columns
Similarily here, there is a significant difference between the comparison types but in this case the post-hoc testing shows a difference between the comparisons of apo-holo and holo-holo structures for CDR3 loops only.
Conclusion
Overall, this analysis has showed that all six CDR loops undergo bulk conformational changes between apo and holo states, but that only the CDR3 loops (both \(\alpha\)- and \(\beta\)-chain) deform when the loops are aligned to each other.